Our Approach
Investment Philosophy
A disciplined, research-driven value strategy built on independent fundamental analysis, rigorous process, and a structure designed to think differently.
Core Philosophy
Maximize return by buying improving companies at reasonable valuations.
Focus on fundamental improvement and valuation discipline: Seek companies with improving business fundamentals trading at prices that may not fully reflect their value.
Investing through company cycles: Companies experience reversion, but they beat the fade or accelerate the turn by investing in the future without too much leverage or using their profits wisely and avoiding overinvesting at the top.
Position sizing and risk limits embedded in the process: Portfolio construction balances conviction with risk management through diversification and monitoring frameworks.
Fundamental research with a capital allocation focus: Evaluate uses of capital to identify those with a strategy of "hope" by investing during all phases but not being too "greedy" by overspending in peaks; looking for those who are investing but without too much leverage.
Prefer identifiable catalysts and conservative underwriting: Investment cases are structured around catalysts that may drive revaluation and are not fully captured by current valuation to preserve downside protection.
The game against expectations
The Lens Behind the Philosophy
Every investment decision we make passes through a single lens: what is the current state of fundamentals and recent change which drive expectations? Then, we forecast the future direction of those fundamentals and whether there's a gap between what price implies and we believe, as this is where returns live.
Performance level (ROIC) runs top to bottom; the change in performance (ΔROIC) runs left to right - improving on the left, declining on the right. Companies rotate clockwise: Phase I (poor, declining) → Phase II (improving) → Phase III (great, improving) → Phase IV (declining) → back to Phase I.Source: G. Kevin Spellman, PhD, CFA, "The Expectations Clock: A Unified Model for Over- and Under-Reaction," PhD thesis at Durham University (United Kingdom) under advisement and examination of pioneers of behavioral finance and recommenders and students of multiple Nobel prize winners in economic science for work in behavioral economics. Spellman is "Coach" to the students and Professor of Practice and David O. Nicholas Director of Investment Management at the Lubar College of Business at University of Wiscosin Milwaukee, and Adjunct Professor at IE Business School.
The model begins with a behavioral fact, as depicted in The Expectations Clock. Expectations anchor to recent level and change in performance. When results are strong and have been improving, expectations run high; when they are weak and have been deteriorating, expectations run low. Performance itself cycles, so expectations cycle with it, and at the extremes they overshoot. When expectations are high, negative events may be ignored - an under-reaction that produces short-term momentum. When expectations are low, negative circumstances may be over-emphasized - an over-reaction that produces long-term reversion. Under-reaction is the basis of momentum; over-reaction is the basis of reversion and the efficacy of value investing. We invest across all phases of the cycle, but may have more or less portfolio weight in each phase depending on the opportunity based on individual stock situations or the position in economic and financial market cycles that favor stocks in different phases of The Expectations Clock. In each phase, we are looking for companies that are improving more than, or deteriorating less than, others and at stock prices that underappreciate the future fundamental developments.
Companies can move around The Expectations Clock. Given enough time, firms can travel around all four phases around The Expectations Clock, and the market's expectations chase it around the loop. We call this rotation The Expectations Clock - a framework that maps where a company sits today and, more importantly, where it is heading next.
Dynamic Security Selection Across The Clock Phases
There are better or worse performing stocks in each phase of The Expectations Clock. The differentiation depends on the direction of future profitability and initial valuation, and the direction of profitability may depend on prudent usage of profits and investment.
The Expectations Clock
Phase 3
High Performers / Improving
Phase 4
High Performers / Deteriorating
Phase 2
Low Performers / Improving
Phase 1
Low Performers / Deteriorating
Phase 1 · Bottom-Right
Low Performers / Deteriorating
Companies enduring severe environmental duress, where expectations and psychological inertia are at their absolute lowest. Market participants routinely over-react to negative stimuli here, driving equity valuations down to deeply distressed levels. While deep value investors may rush into this space, falling directly into value traps by purchasing structurally terminal businesses that look cheap but are permanently broken, we look for those firms that have a plan for rebound.
Case for Investment: Operational Improvement
The case for selecting these companies is simple: reversion. There is significant pressure on management to fix the operations or perhaps an economic cycle headwind reverses and becomes a tailwind. Given that performance is low and deteriorating, most investors do not expect the reversal and this leads to opportunities. We look for companies that are investing to reverse their fortunes but not so much as it leads to rising debt ratios. Our process isolates companies whose low stock prices are a reflection of temporary market pessimism rather than permanent corporate ruin.
Phase 2 · Bottom-Left
Low Performers / Improving
As fundamentally sound firms transition into Phase 2, operational metrics are on the rise, yet market expectations may remain anchored to past failures. This informational gap creates an excellent window for active managers, as subsequent quarterly earnings announcements routinely trigger positive surprises that drive the stock price upward.
Case for Investment: Validates the Turnaround
The case for these companies is simple: improvement may continue. Highly fragile companies may experience brief, artificial spikes in profitability due to temporary cost-cutting or random macro tailwinds; however, we seek companies that continue to build on their improvement by investing but without too much leverage. We also seek relatively cheap stocks that do not price in further improvement which provides us with a margin of safety.
Phase 3 · Top-Left
High Performers / Improving
Phase 3 defines the peak of corporate optimism, characterized by exceptional past success, high market expectations, and maximum cognitive inertia. In this phase, the corporations themselves and their investors frequently fall prey to overconfidence, aggressively expanding opertations and bidding up expensive stock prices under the assumption that peak growth will compound indefinitely.
Case for Investment: Defensive Discipline
The case for these companies is simple: they are good businesses. While we seek firms that are continuing to invest to stay ahead and improve further, many companies overinvest as they do not see the trend reversing. Competition has their eyes on them, products mature, and cycles turn. Profits are high so a firm should have enough to invest and to also pursue other valuable activities such as share buybacks, debt paydown, dividends, and growing cash. These stocks tend to be highly valued, and given that these firms may slow and revert, we don't want to pay up too much. Paying attention to valuation protects our portfolio from late-stage market bubbles.
Phase 4 · Top-Right
High Performers / Deteriorating
The final phase of the clock represents a critical danger zone for capital preservation. While a company's operational efficiency has quietly fractured under the hood, general market expectations may remain high. Investors routinely under-react to initial earnings misses and early negative events, incorrectly assuming a structural breakdown is just a temporary dip.
Case for Investment: Risk Mitigation & Rebound
The case for these companies is simple: while deteriorating, they are still good businesses. To deal with the deterioration, some companies may slash expenses to shore up profits. While this may temporarily lift profits, it may only put a bandage on the problem, and if they cut valuable investments (R&D, marketing, and capital spending) it could ensure the continued decline. We focus on companies that will reverse the fade by investing but without boosting leverage. Since the businesses are still strong even though they are weakening, valuation may be high, and we look for stocks trading at a discount to minimize our risk.
At every point on The Clock we compare the expectations embedded in valuation against the fundamental trajectory. That comparison, not the absolute quality tier, tells us whether an improvement is already incorporated in market prices or still available to us. The Expectations Clock does more than locate a company - it lets us frontrun the investment community's expectations. By reading where a company sits today and where its ROIC is heading next, we position ahead of the market's repricing rather than chasing it.
The Expectations Clock is the work of Dr. G. Kevin Spellman, CFA, whose research on over- and under-reaction informs how the fund reasons about corporate cycles and expectations.
Fundamentals and Valuation
Philosophy supported by investing and academic greats, and with improvements. The fundamentals behind the price, and how we read what the market already expects...
Fundamentals
We pay close attention to level of return on capital (ROIC), change in ROIC, investment spending and other uses of profits, and leverage.
- Level of return on capital (ROIC)
- Change in ROIC
- Investment spending and other uses of profits
- Leverage
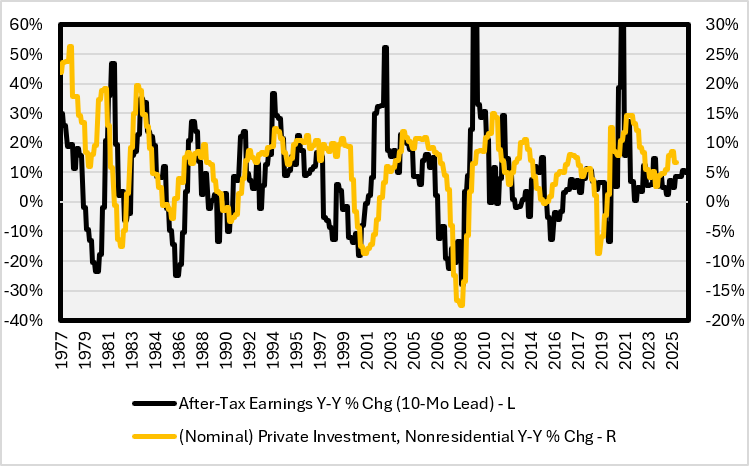
At different points in the cycle, different risks dominate. At peaks, the danger is overinvestment - capital deployed at the top that destroys rather than creates value. At troughs, the danger is underinvestment - management is retreating precisely when there is chance to turn things around. The companies that beat the fade or accelerate the turn may do so by investing in the future without the excess leverage that kills optionality when conditions change. Capital allocation is not a footnote; it may be the mechanism through which improvement either compounds or evaporates.
Avoid overinvestment at peaks; ensure capital deployment is accretive.
Avoid underinvestment in troughs; ensure management is looking long term.
Firms Overinvest at the Peak of the Earnings Cycle and Underinvest at the Trough
Quality Factor
A core tenet of our investment philosophy at the Wisconsin Value Fund is that systematic filtering must go beyond simply identifying inexpensive stocks. True value investing demands a rigorous, dual-focus approach that pairs strict valuation discipline with an uncompromised evaluation of business quality and change in quality. While secondary market narratives often become distracted by short-term price momentum, structural alpha is earned by understanding how corporate efficiency compounds wealth over time.
Return above the cost of capital is the only return that creates value. The measure that captures it is Economic Value Added - EVA - the difference between ROIC and WACC: the return a business earns on its invested capital, less the return that investors who provided the capital demand. When ROIC sits above WACC the EVA spread is positive and value is being built; when it slips below, value is destroyed. We look for companies that are improving ROIC and therefore EVA. A firm that is greedy overinvests at peaks may cause ROIC to fall further than one that is fearful and does not, and one that has some hope at invests at bottoms may drive the cycle to rebound or benefit from a rebounding cycle vs the one that is fearful and retrenches.
Full range of capital allocation
- •CapEx, R&D, Brand & Promotions
- •M&A
- •Dividends
- •Share buybacks
- •Cash
- •Debt
Investing for the future
- •Without too much leverage
- •Ensure management is focusing on long-term results
ROIC and capital investment are related. Investment is the denominator of ROIC, so if it is not put to good use it will not generate profits, which is the numerator. Part of what management often gets wrong is timing, which The Expectations Clock shows. However, we know from great investors including Warren Buffett, that getting it right compounds returns. He looks for high ROE (or ROIC) companies that generate strong free cash flow (so they don't blow their profits by overinvesting). Eugene Fama, a Nobel Prize Winner in Economic Sciences, codified ROIC and capital spending into two of his five factors in his five-factor model.
Let us break the five-factor model into its constituent elements. The left side represents the excess return of a specific stock, calculated as the stock's actual return minus the risk-free rate of return. On the right side, the model explains this return using five return premium drivers. The first driver is the equity risk premium. The second and third drivers are the traditional Size factor (SMB, or Small Minus Big stocks) and the traditional Value factor (HML, or High Minus Low book-to-market stocks). The fourth driver, RMW (Robust Minus Weak), captures the profitability premium - the tendency of highly profitable firms to outperform weakly profitable ones. The fifth driver, CMA (Conservative Minus Aggressive), captures the investment premium - the tendency of conservatively investing firms to outperform those that invest aggressively.
Fama-French Five-Factor Asset Pricing Model
Click any term with a gold line to learn more · ★ marks our focus factor
The stock's actual return minus the risk-free rate of return.
Adapted from Fama, E. F., & French, K. R. (2015). A five-factor asset pricing model. Journal of Financial Economics, 116(1), 1-22.
What is missing from the five-factor model, which Dr. G. Kevin Spellman, CFA, offers in The Expectations Clock, is that companies may change over time, and different corporate strategies and behavioral blunders may be present during various phases of their cycles. Advised by Dr. Werner DeBondt (pioneer in behavioral finance writing a seminal piece "Does the Stock Market Overreact?" and PhD student of Nobel Prize in Economic Sciences winner Richard Thaler), Dr. George Wright (recommender of Daniel Kahneman for the Nobel Prize in Economic Sciences), Dr. Robert Watson (expert in corporate governance), PhD examiner Dr. Daniel Reed (PhD student of Daniel Kahneman), and other advisors, Dr. Spellman showed that companies, industries, and markets cycle over time.
Companies do not always remain in the high or low or improving or declining profitability buckets. Firms may sometimes invest aggressively, and sometimes conservatively. Fama claims that conservative companies outperform aggressive companies over time and Spellman's earlier research shows the same; however, Spellman also showed that those with moderate spending plans perform well. Moderation - not too hot or too cold - over the entire cycle may be best and better than low investment as without investing a firm cannot grow and create the most value. Fama also shows that high ROIC companies - like Warren Buffett's holdings - perform best over the long-run; however, there are clearly periods when low profitability companies outperform high profitability companies such as during economic recoveries, and vice versa. Low profitability companies may also be cheapest and we are acutely in tune to how inexpensive companies tend to outperform pricey stocks during economic rebounds, and vice versa.
We agree with Warren Buffett in that we like companies that have conservative use of leverage. Low change in debt and lower levels gives a firm financial flexibility and reduces risk. One way to tell if management is investing too aggressively is by observing if leverage ratios are on the rise. That is a sign of overconfidence and perhaps overinvestment, especially if profits are high. ROIC does not differentiate whether capital is funded with debt or equity, so it is a pure measure of operating success. However, ROE can tell us if that success is funded by debt or equity depending on the direction of the asset to equity ratio.
Five-Part DuPont Identity
Click any fraction with a gold line to learn more
Tax Efficiency
Measures the tax burden on earnings.
Risky investments may rely on that final fraction, stacking up dangerous amounts of debt to artificially inflate their return on equity. Our strategy flips this dynamic. We filter out those firms that are increasing leverage to explicitly targeting businesses that are improving the middle two fractions - EBIT/Sales and Sales/Assets, meaning they generate wealth through rising profit margins and/or rising asset turnover. When we apply these mathematical principles to shifting market cycles and investor behavior, we gain an active blueprint for capital preservation and growth.
Valuation
Just as we consider leverage as a corporate risk factor, we also consider valuation as a stock risk factor. Fama suggests that lower valuation is better and Warren Buffett has said that "It's far better to buy a wonderful company at a fair price than a fair company at a wonderful price." We are keenly aware that more profitable firms deserve higher valuations than those that are lower, so we evaluate current valuation relative to the level of fundamentals and expected and actual changes in fundamentals. We are always seeking companies that are fundamentally improving, which should drive up valuation multiples if we buy them at the right prices; prices that give a margin of safety to whatever today's fundamentals warrant.
Two measures locate a company. Its place on the horizontal axis is what the price already expects - elevated on the left, lower on the right. Its place on the vertical axis is what the EVA spread is actually doing - improving at the top, fading at the bottom.
Top left - Priced in
Improvement is real but already reflected in an elevated price. The strategy here is to find companies whose EVA spread is widening faster than the price implies, so the re-rating has not yet run its course. Discipline on entry price is the edge.
Top right - Positive surprise
Prices are declining and the valuation multiple is relatively low, but the EVA spread is widening. The market has not yet conceded the turn. This is where positive surprise is most likely and re-ratings run deepest.
Bottom left - The trap
Prices are elevated but the EVA spread is fading. The setup for disappointment. The strategy here is sell discipline: avoid or exit before the de-rating arrives, and rotate capital toward companies where the spread is still improving.
Bottom right - Limited damage
Prices are declining and the decline is already in the price. Little left to lose. The strategy is to identify companies whose spread is about to inflect upward, before the market sees the turn. A low multiple alone is not a thesis; but with a widening EVA it is.
Security Selection
Improving business fundamentals at prices that may not reflect intrinsic value.
Prefer underappreciated quality - the mispricing is in the trajectory but also perhaps the absolute quality tier.
Identifiable catalysts that may drive revaluation, underwritten conservatively.
Conservative balance sheets and resilient cash-generation profiles that preserve optionality.
Favor companies where management is investing for the long term, not over-spending at peaks or retreating at troughs.
Process - Three Pillars
Professional Oversight
Mentors: Three investment professionals with roughly 100 years of experience, including top roles and portfolio management.
Dana Investment Advisors: Ranked #1 on the CNBC FA 100 in 2021 and a top-ten firm for seven consecutive years - providing institutional oversight.
Large Team of Analysts: Analysts in their second year of training with 16-year performance under a professor.
Professional Oversight: A board of advisors and UWM foundation members comprising investment professionals who students report to three times yearly.
Decision Making
Committee Decision-Making: Decisions made by committee to encourage debate and reduce individual bias before commitment.
Buy Process: Thesis-driven with documented catalysts, assumptions, and risk factors before any capital commitment.
Trim Discipline: Scale back positions when valuation reaches a point where the risk/return ratio is less favorable than other opportunities.
Sell Discipline: (1) Better opportunities present themselves, (2) thesis invalidation - exit when the original case no longer holds or deteriorates, and (3) forced meetings to determine exit if a stock declines more than a set threshold vs its sector.
Risk Management
Position Sizing Discipline: Sector weights +/- 8% vs benchmark thresholds to enforce conviction-based sizing and portfolio control.
Stock Sizing Discipline: Stock weights +/- 7% vs benchmark thresholds to control portfolio relative return risk.
Monitoring Cadence: Regular reviews that assess thesis validation, position performance, and evolving risks over time.
Documentation & Accountability: All theses documented with rationale, assumptions, catalysts, and risk factors for accountability.
What We Mean by Value
Value, in our framework, means buying any company - high quality or low - where the valuation does not fully reflect the improvement trajectory.
We focus on companies with prudent uses of profits and investments and conservative underwriting, identifiable catalysts, and a clear view of downside before any capital is committed.
Value in practice means:
Buying improving companies before the market prices in the improvement.
Relative valuation - what is the market expecting vs. what we expect?
Patience to wait for the mispricing and discipline to sell when it resolves.
This is what makes our approach different.
We challenge consensus through a structure that rewards intellectual honesty, a process that enforces discipline based on empirical results, and a team rotation model that creates re-evaluation loops unavailable in most professional seats.
Philosophy, process, and structure all ladder up to the same outcome: a repeatable, differentiated approach to finding companies the market has mispriced.
Important Information
This website is provided for informational purposes only and does not constitute investment advice or an offer to sell or a solicitation of an offer to buy any security. Investing involves risk, including possible loss of principal. The Wisconsin Value Fund is not a registered investment adviser. Please review our full Disclosures before making any investment decisions.